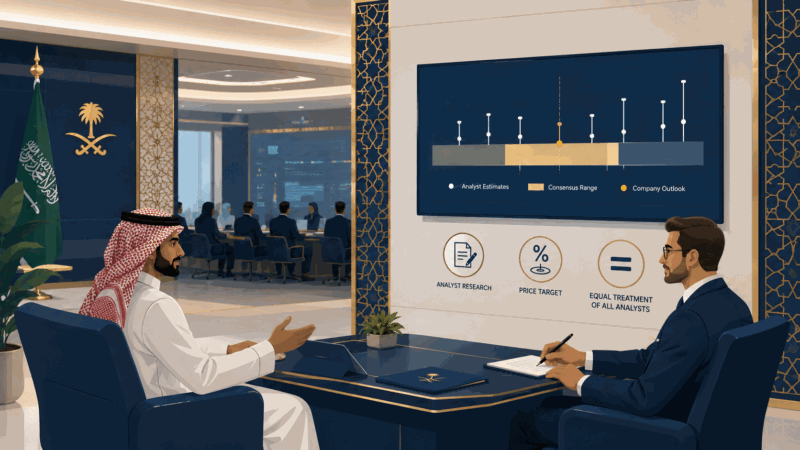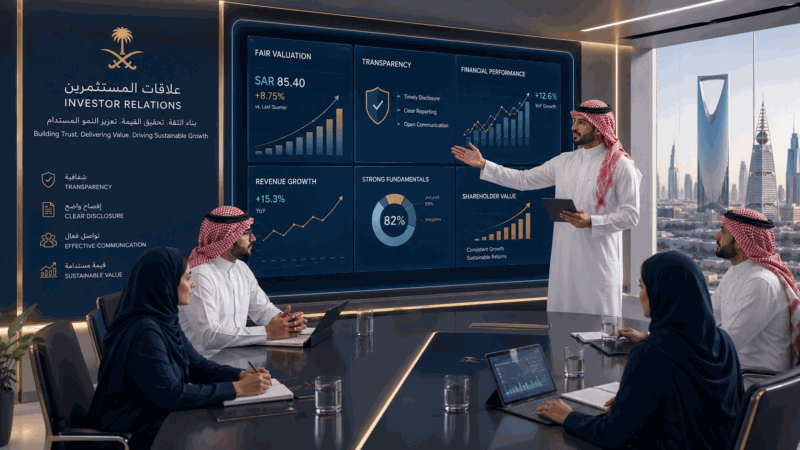
Measuring Investor Relations Effectiveness

Measuring Investor Relations Effectiveness KPIs, Perception Studies, Benchmarking, and Continuous Improvement
First: Introduction
“What is not measured cannot be managed.” This famous management rule applies strongly to investor relations. Companies that don’t measure IR effectiveness don’t know what works and what doesn’t, invest without direction, and miss improvement opportunities. Companies that measure systematically evolve their function over time, prove its value to senior management, and achieve tangible results. Measuring IR effectiveness combines quantitative and qualitative, direct and indirect, short-term and long-term. No single indicator summarizes everything — it’s a system of indicators together. This article reviews quantitative and qualitative indicators, perception studies, benchmarking, and awards. It also covers how to build a measurement dashboard for senior management and how to use data for improvement.
Second: Why Measurement Matters
1. Proving Value
1.1 To Senior Management
- CEO, CFO, board.
- Justifying budget.
- Justifying resources.
- Showing ROI.
1.2 To the Company
- IR is investment function.
- Needs to prove return.
- With numbers.
- With results.
2. Self-Improvement
2.1 Knowing What Works
- Effective activities.
- To focus on.
- To invest in.
2.2 Knowing What Doesn’t Work
- Weak activities.
- To change.
- To stop.
- To free for better.
3. Decision-Making
3.1 Priorities
- Limited budget.
- Limited time.
- Measurement guides.
3.2 Resources
- Team allocation.
- Budget for effective activities.
- Efficiently.
4. Comparison
4.1 With Peers
- Where we are.
- Where we should be.
- The gap.
4.2 With Self Over Time
- Evolution.
- Improvement.
- Trends.
Third: Quantitative Indicators on the Share
1. Valuation Premium
1.1 Definition
- Difference between company valuation and peers.
- In multiples (P/E, EV/EBITDA).
- Adjusted for performance.
- Governance and transparency premium.
1.2 Calculation
- Company multiple - sector average.
- Or ratio (multiple / average).
- Over time.
1.3 Benchmark
- Strong IR companies: 10-25% premium.
- Weak IR companies: discount.
- Global studies.
2. Volatility
2.1 Definition
- Degree of share fluctuation.
- Standard deviation.
- Of daily returns.
2.2 Why Important
- Strong IR = less volatility.
- Clear information.
- Controlled expectations.
- Investor trust.
2.3 Comparison
- With index.
- With peers.
- Over time.
3. Liquidity
3.1 Indicators
- Daily trading volume.
- Turnover ratio.
- Bid-ask spread.
- Market depth.
3.2 Impact
- Strong IR = higher liquidity.
- Attracting investors.
- Ease of entry and exit.
4. Cost of Capital
4.1 Indicators
- Lending margin.
- Equity cost (CAPM).
- WACC.
4.2 Impact
- Higher transparency = higher trust.
- Lower perceived risk.
- Lower financing cost.
- Saving millions annually.
5. Performance vs Consensus
5.1 Beat/Miss
- Rate of beating consensus.
- Over time.
- In earnings and revenues.
5.2 Standard
- 60-80% beat = good expectations management.
- 90%+ = excessive conservatism.
- <50% = weakness in expectations management.
Fourth: Quantitative Indicators on Investor Base
1. Institutional Base Size
1.1 Indicators
- Institutional ownership ratio.
- Number of institutions.
- Average investment size.
1.2 Trends
- Growth annually.
- Quality.
- Presence.
2. Diversity
2.1 Geographic
- Local vs international.
- By continents.
- By countries.
2.2 In Style
- Growth, value, income.
- Active, passive.
- ESG, traditional.
2.3 In Size
- Large.
- Medium.
- Small.
3. Stability
3.1 Indicators
- Average holding period.
- Annual retention rate.
- Base turnover.
3.2 Standard
- Higher retention = long-term investment.
- Lower turnover = stability.
4. New Investors
4.1 Indicators
- Number of new annually.
- Their quality.
- Their investment size.
4.2 Sources
- Where they came from.
- Result of which activity.
- To assess effectiveness.
Fifth: Indicators on Analyst Coverage
1. Number of Analysts
1.1 Total
- Number evolution.
- Annually.
1.2 Standards
- Major companies: 15-30.
- Medium: 5-15.
- Small: 1-5.
2. Coverage Quality
2.1 Banks
- Major international banks.
- Regional banks.
- Local banks.
2.2 Analysts
- Analyst reputation.
- Their specialization.
- Their following.
3. Recommendations
3.1 Distribution
- Buy ratio.
- Hold ratio.
- Sell ratio.
3.2 Trend
- Improvement or deterioration.
- Over time.
4. Price Targets
4.1 Indicators
- Average target.
- Range.
- Compared to current price.
4.2 Consensus
- Consensus quality.
- Consistency.
- Deviation.
Sixth: Indicators on Activities
1. Meetings
1.1 Number
- Investor meetings.
- Analyst meetings.
- Annually.
1.2 Quality
- With major investors.
- Valuable information.
- Follow-up.
2. Events
2.1 Number
- Earnings calls.
- Roadshows.
- Conferences.
- Investor Day.
2.2 Attendance
- Number of participants.
- Their quality.
- Engagement.
3. Disclosures
3.1 Compliance
- On time.
- With rules.
- Without violations.
3.2 Quality
- Completeness.
- Clarity.
- Usefulness.
4. Digital
4.1 Website
- Monthly visits.
- Popular pages.
- Visit time.
- New visitors.
4.2 Social Media
- Followers.
- Engagement.
- Sentiment.
Seventh: Qualitative Indicators
1. Investor Feedback
1.1 Question Quality
- In meetings.
- On calls.
- Shows level of understanding.
- And strategy.
1.2 Returned Feedback
- Direct observations.
- On materials.
- On communication.
- On strategy.
2. Analyst Feedback
2.1 Report Quality
- Do they understand strategy.
- Analysis.
- Model.
2.2 Responses
- Response speed.
- Their quality.
- Usefulness.
3. Sector Reputation
3.1 Awards
- Best IR Awards.
- In the region and world.
- Recognition.
3.2 Mention
- In media.
- In peer reports.
- Model to emulate.
Eighth: Perception Studies
1. What They Are
1.1 Definition
- Study of investor and analyst feedback.
- Systematic.
- Confidential.
- Comprehensive.
1.2 Benefit
- Knowing real perception.
- Without flattery.
- Strengths and weaknesses.
- For improvement.
2. Execution
2.1 Methods
- Phone or in-person interviews.
- Online surveys.
- Deep discussions.
- Confidentially.
2.2 Executor
- Third party professional.
- Not the company itself.
- To ensure honesty.
- Specialized firms.
2.3 Sample
- 15-30 investor/analyst.
- Diverse.
- Representative.
- With permission.
3. Content
3.1 Topics
- Strategy.
- Management.
- Communication.
- Disclosures.
- ESG.
- Comparison with peers.
3.2 Questions
- What works well.
- What needs improvement.
- What are priorities.
- With examples.
4. Frequency
4.1 Comprehensive
- Annually.
- Comprehensive.
- For full assessment.
4.2 Focused
- Quarterly.
- Brief.
- On specific topics.
5. Results
5.1 Report
- Summary for management.
- Detailed findings.
- Recommendations.
- Action plan.
5.2 Application
- Identifying priorities.
- Allocating resources.
- Implementing improvements.
- Follow-up.
Ninth: Benchmarking
1. With Direct Peers
1.1 Selection
- Same sector.
- Same size.
- Same markets.
- 3-5 companies.
1.2 Comparison
- IR practices.
- Disclosures.
- Activities.
- Website.
- Reports.
2. With Leaders
2.1 Selection
- Global leading companies.
- With distinguished IR.
- In any sector.
- For inspiration.
2.2 Benefit
- Best practices.
- New ideas.
- Quality standards.
- Aspiration.
3. Methodology
3.1 Elements
- Website (assessment).
- Annual report (assessment).
- Earnings calls (analysis).
- ESG (comparison).
- Disclosures (comparison).
3.2 Scoring
- Specific criteria.
- By points (1-10 for example).
- By averages.
3.3 Report
- Comprehensive.
- With gaps.
- With opportunities.
4. Frequency
- Annually usually.
- Or every two years.
- Over time.
Tenth: Awards and Recognition
1. International Awards
1.1 IR Magazine Awards
- Most prominent globally.
- With multiple categories.
- By nominations.
- Neutral assessment.
1.2 IR Society Awards (UK)
- For UK practices.
- High standards.
- Strong recognition.
1.3 NIRI Awards (US)
- For American companies.
- With multiple categories.
- The oldest.
2. Regional Awards
2.1 MENA IR Awards
- For the region.
- Organized by MENA IR Association.
- With growing importance.
2.2 GCC Awards
- For Gulf states.
- With strong competition.
3. Local Awards
3.1 Tadawul Awards
- For disclosure and transparency.
- For governance.
- Recognition from the market.
3.2 CMA Recognition
- For distinguished practices.
- By specific criteria.
4. Benefits of Awards
4.1 Motivation
- For team.
- For leadership.
- For continuation.
4.2 Reputation
- For company.
- For share.
- For attraction.
4.3 Standards
- Award criteria raise quality.
- Over time.
Eleventh: Dashboard for Senior Management
1. Design
1.1 Principles
- Visual.
- With few indicators.
- With comparisons.
- With trends.
1.2 Key KPIs
- 5-10 core indicators.
- Selected.
- Valuable.
2. Standard Content
| Indicator | Period | Comparison |
|---|---|---|
| Valuation premium | Quarterly | With peers |
| Institutional ownership ratio | Quarterly | With prior year |
| Number of analysts | Quarterly | Trend |
| Average consensus | Quarterly | Trend |
| Activities (meetings, events) | Quarterly | With plan |
| Website visits | Quarterly | Trend |
| Perception study scores | Annual | With prior year |
3. Presentation
3.1 To Board
- Quarterly.
- Concise.
- Strategic.
3.2 To Audit Committee
- Quarterly.
- In detail.
- With risks.
3.3 To CEO/CFO
- Monthly.
- With more detail.
- With actions.
Twelfth: Measuring IR ROI
1. The Challenge
1.1 Difficulty
- Difficult to measure precisely.
- Many variables.
- But possible.
1.2 Approach
- Estimative.
- With approximate indicators.
- With logic.
2. ROI Components
2.1 Benefits
- Valuation premium: billions in market cap.
- Lower cost of capital: millions annually.
- Higher liquidity: basis points.
- Strategic flexibility: priceless value.
2.2 Costs
- Annual IR budget.
- Salaries.
- Activities.
- Technology.
2.3 Comparison
- Benefits > costs by multiples.
- Large ROI usually.
- Profitable investment.
3. Presenting It
3.1 To Management
- With clear numbers.
- With logic.
- With professional caution.
3.2 Caveats
- Don’t claim what can’t be proven.
- With credibility.
- Methodologically.
Thirteenth: Continuous Improvement
1. The Cycle
1.1 Measurement
- Regular.
- Comprehensive.
1.2 Analysis
- Of results.
- Of gaps.
- Of opportunities.
1.3 Plan
- For improvement.
- With priorities.
- With timeline.
1.4 Execution
- With discipline.
- With follow-up.
1.5 Remeasurement
- To verify.
- To learn.
- Periodically.
2. Common Mistakes
2.1 Measuring Too Much
- Without priority.
- Losing focus.
- Solution: focus.
2.2 Measuring Without Action
- Reports without implementation.
- Solution: link measurement to action.
2.3 Wrong Indicators
- Focus on quantity not quality.
- Solution: thoughtful indicators.
2.4 No Communication
- Results stay in IR.
- Solution: share with senior management.
Fourteenth: Developments in Measurement
1. Artificial Intelligence
1.1 Advanced Analysis
- Sentiment analysis.
- Pattern analysis.
- Predictions.
1.2 Automation
- Data aggregation.
- Report preparation.
- Time savings.
2. Big Data
2.1 Sources
- Social media.
- News.
- Trading.
- Research.
2.2 Analysis
- Comprehensive.
- Multi-dimensional.
- In real time.
3. Integrated Platforms
3.1 Features
- All indicators in one place.
- Interactive dashboards.
- Alerts.
3.2 Examples
- Q4 IR Platform.
- Nasdaq Boardroom.
- S&P Capital IQ.
Fifteenth: Best Practices
1. At Strategy Level
- Measurement as culture: continuous.
- Selected indicators: carefully.
- Linking to goals: strategic.
- Commitment to measurement: over time.
2. At Methodology Level
- Quantitative and qualitative: together.
- Direct and indirect: integrated.
- Short and long term: balanced.
- With logic: thoughtful.
3. At Application Level
- Professional dashboard: for management.
- Perception studies: regular.
- Benchmarking: comparative.
- Improvement: continuous.
4. At Communication Level
- Transparency: for management.
- Persuasion: for resources.
- Celebration: of successes.
- Responsibility: for gaps.
Conclusion
Measuring IR effectiveness is not luxury but necessity. Companies that measure systematically understand their function deeply, prove their value to management, and continuously improve. Companies that don’t measure remain in the dark, invest without direction, and miss growth opportunities. Measurement transforms IR from ‘cost’ to ‘investment,’ from ‘routine work’ to ‘journey of excellence.’ In the Saudi capital market, the importance of measurement grows with market maturity and global investor expectations. Leading Saudi companies invest in sophisticated measurement systems, conduct regular perception studies, and compare themselves with regional and international peers. This commitment to excellence pays for itself tangibly: valuation premiums, strong investor base, global reputation. With Vision 2030 and market growth, opportunities for outstanding IR will increase. Investment today in building a measurement and improvement culture is investment in the entire company’s future. And with the conclusion of this pillar, we hope you have built a comprehensive understanding of investor relations as an indispensable strategic function for ambitious listed companies.
Contact US
References and Sources
- NIRI — Measuring IR Effectiveness.
- IR Society UK — IR Performance Metrics.
- IR Magazine Awards — Categories and Criteria.
- Rivel Research — Perception Studies.
- Brunswick Group — IR Effectiveness Reports.
- Q4 — IR Benchmarking.
- Nasdaq Boardroom — IR Analytics.
- S&P Capital IQ — IR Intelligence.
- MENA IR Association — Regional Awards.
- Tadawul — IR Excellence Recognition Programs.
FAQ
Why is "Perception Study" considered the gold standard for qualitative measurement?
Quantitative data tells you what happened, but a perception study tells you why. By using a third party to interview analysts and investors, you bypass the "flattery" of direct feedback and uncover the actual gaps in your strategy, communication, and market positioning.
How do you prove ROI for an IR function to the Board?
ROI in IR is best demonstrated by tracking "Valuation Premium" (your company's trading multiple relative to sector peers) and "Cost of Capital" (lower perceived risk leads to lower borrowing costs). When combined with clear evidence of increased institutional ownership and analyst coverage, the value of the function becomes undeniable.
What is the ideal number of KPIs for an IR dashboard?
For senior management (CEO/CFO), focus on 5–10 core indicators. The dashboard must be visual, trend-based, and compared against peers. Overloading management with dozens of operational metrics causes focus drift; keep the dashboard strategic.